Percent Medicaid
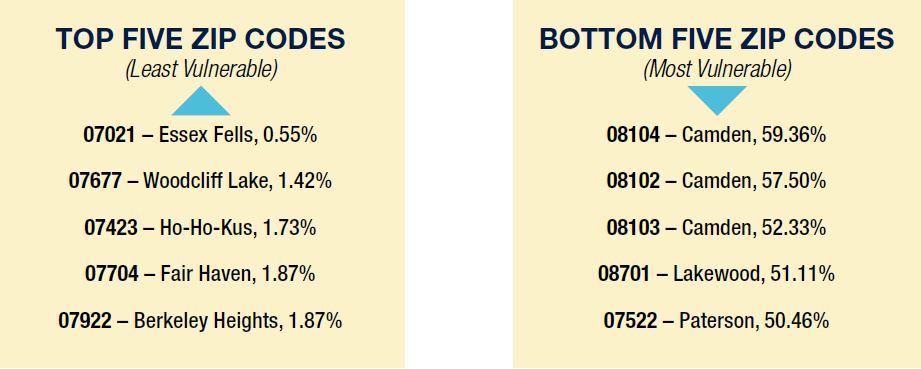
The recent Medicaid expansion included as part of the ACA has significantly reduced the number of uninsured in New Jersey. Unfortunately, New Jersey ranks first in the country in the number of primary care practices that do not accept Medicaid patients. About 70 percent of all U.S. office-based physicians accept new Medicaid patients, including two-thirds of primary care physicians and close to three-quarters (72 percent) of specialists. The percentage of physicians accepting new Medicaid patients varies by state, ranging from 39 percent in New Jersey to 97 percent in Nebraska26, leaving these patients to seek services for primary care conditions in the hospital emergency room, the most-costly setting of care. The zip code range for this measure varies significantly from a low of just 0.55 percent of residents in a single zip code covered by Medicaid to a high of 59.4 percent. The median for the 38 zip codes with the poorest health status is 38 percent, versus a statewide median of 10 percent – or 3.7 times greater. See Appendix.
Demographic characteristics and age/race variation
In addition to profiling New Jersey’s 537 zip codes based on the 20 measures selected for this study, CHART also conducted a broad demographic review of communities across the state. New Jersey, like many northeastern states, is a melting pot of young/old, affluent/poor, and a full complement of races and ethnicities.
The median age of New Jersey’s population 41.9 year, and the racial composition is 68 percent White, 13.4 percent Black, 9.4 percent Asian and 9.1 percent other (American Indian, Islander, multi-racial, other). In addition, nearly 20 percent of residents identify themselves as Hispanic. However, comparing the profiles of the strongest 35 zip codes and the weakest 38 zip codes from a health status/vulnerability perspective reveals significant differences in demographics.
The data show that New Jersey’s most vulnerable communities tend to have a population that is younger and predominantly minority than the population of the state as a whole.