ED Chronic Conditions
ED Mental Health/SUD
Low Acuity ED Visits
Life Expectancy
Uninsured
Medicaid
No HS Diploma
Income
Unemployed
Demographics
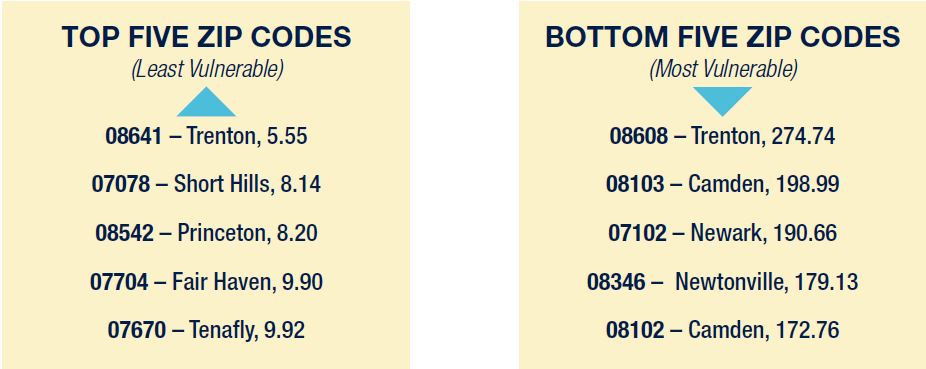
Emergency department visits with two or more chronic condition diagnoses present in a patient’s record, per 1,000 population
Chronic conditions such as hypertension, diabetes, asthma, obesity, and high cholesterol all contribute to poor health status. CHART measured the variation across zip codes and found significant differences. The statewide range by zip code was from a low of 5.6 visits per 1,000 population to a maximum of 275 visits per 1,000 population. In the 38 zip codes with the poorest health status, the median was 91.7 visits per 1,000 population, versus the statewide median of 37.2 – or 2.5 times greater.
A Deeper Dive
Trenton zip codes top both the least vulnerable and most vulnerable lists in this indicator. Both areas are served by the Trenton Post Office, but beyond that commonality their characteristics are vastly different. Zip code 08641 encompasses five square miles of primarily military base housing at Joint Base McGuire-Dix-Lakehurst, with 60 percent of the residents serving in the military. The unemployment rate is 7.4 percent, the median age is 23 and the median household income is around $63,100. Zip code 08608, meanwhile, covers several blocks of downtown Trenton, between the Mill Hill neighborhood and the Delaware River. Fourteen percent of its residents are unemployed, with a median age of 36 and a median household income of approximately $25,000. The stark differences between these two communities are reflected in their ability to access consistent care to manage chronic health conditions.
Emergency department visits with mental health or substance use disorder diagnosis present in a patient’s record, per 1,000 population
Hospital emergency departments are the 24/7 safety net for patients suffering from mental health or substance use disorders. The range for this measure was even more distressing than the chronic conditions measure. The statewide zip code range was from a low of 14.4 visits per 1,000 population to a maximum of 517 visits per 1,000 population. In the 38 zip codes with the poorest health status the median was 149.7 visits per 1,000 population versus a statewide median of 60.9 – or 2.5 times greater.
Low-acuity emergency department visits, per 1,000 population
Patients with limited access to primary care providers or who lack health insurance often utilize the hospital emergency room for low-acuity services. CHART measured the variation across zip codes for this as well. The range was from a low of zero visits to a maximum of 75.6 visits per 1,000 population. In the 38 zip codes with the poorest health status the median was 13.7 visits per 1,000 population versus a statewide median of 4.3 – or 3.2 times greater.
Life expectancy
The statewide variation in life expectancy spans 22 years, with the life expectancy in the weakest performing zip code at 69.2 years and the zip code with the longest life expectancy at 91.4. The median life expectancy in the 38 zip codes with the poorest health status is 75.7 years, versus a statewide median of 80.4 years – or 4.7 years shorter.
Percent Uninsured
Individuals who lack health insurance are limited in their ability to access the healthcare delivery continuum efficiently. Studies have shown that preventative care, early intervention and access to primary care are critical components of maintaining one’s health. While the Affordable Care Act (ACA) made significant inroads toward expanding insurance coverage, many individuals still lack health insurance. CHART’s study showed wide variation in the percent of individuals lacking insurance from community to community, ranging from a low of 0.7 percent to a high of 35.6 percent. The median percent uninsured for the 38 zip codes with the poorest health status is 18.7 percent, versus a statewide median of 6.3 percent – or nearly three times greater.
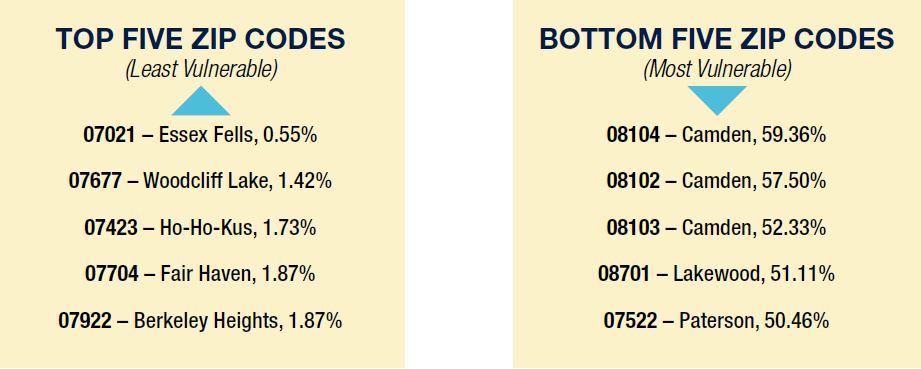
Percent Medicaid
The recent Medicaid expansion included as part of the ACA has significantly reduced the number of uninsured in New Jersey. Unfortunately, New Jersey ranks first in the country in the number of primary care practices that do not accept Medicaid patients. About 70 percent of all U.S. office-based physicians accept new Medicaid patients, including two-thirds of primary care physicians and close to three-quarters (72 percent) of specialists. The percentage of physicians accepting new Medicaid patients varies by state, ranging from 39 percent in New Jersey to 97 percent in Nebraska26, leaving these patients to seek services for primary care conditions in the hospital emergency room, the most-costly setting of care. The zip code range for this measure varies significantly from a low of just 0.55 percent of residents in a single zip code covered by Medicaid to a high of 59.4 percent. The median for the 38 zip codes with the poorest health status is 38 percent, versus a statewide median of 10 percent – or 3.7 times greater.
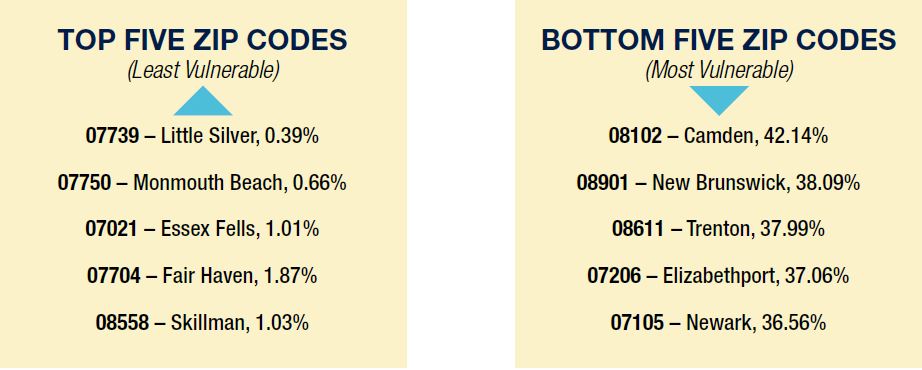
Percent with no high school diploma
Education is a key component of health status/vulnerability. One’s education impacts the ability to secure meaningful employment, generate income which supports basic needs such as housing, food, and clothing. It can also impact an individual’s access to employer-based insurance, not to mention the ability to understand and navigate the healthcare system. Many of New Jersey’s most vulnerable communities have a large percentage of residents that lack a high school diploma. The range is from a low of 0.4 percent to a high of 42 percent. The median percent with no high school diploma for the 38 zip codes with the poorest health status is 27 percent, versus a statewide median of 7 percent – or 3.9 times greater.
A Deeper Dive
Located in the shadow of Rutgers, the State University of New Jersey, zip code 08901 in New Brunswick has the state’s second-highest percentage of residents without a high school diploma, at 38.1 percent. The public schools are part of a Title 1 school district, with 86.5 percent of its students eligible for the federal free or reduced lunch program. About 85 percent of students in the public schools are Hispanic.27 How influential is education on the health of a community? While challenged by other factors such as median household income and uninsured rate, zip code 08901, with the state’s second worst high school graduation rate, ranks 500th among the state’s most vulnerable 537 zip codes.
Median household income
Socio-economic status can serve as a powerful predictor of health status, and the predictive power of income alone can shed light on an individual’s predisposition to disease or lower life expectancy. New Jersey is one of the most affluent states in the nation, yet the variation in median household income from community to community, some abutting one another, is significant. The range in median household income spans a low of just $20,856 to a high of $218,667. The median for the 38 zip codes with the poorest health status is $38,860, versus a statewide median of $87,209 – or 55 percent lower.
Percent unemployed
Job insecurity has a debilitating impact on health status and serves as another strong predictor of health vulnerability. In addition to the aforementioned lack of access to employer-sponsored health insurance and a primary care network, job insecurity or unemployment also creates additional stress that impacts health, including the linkage of poverty and mental illness. Unemployment rates vary widely from community to community in New Jersey, ranging from a low of 1.1 percent to a high of 22.9 percent. The median unemployment rate for the 38 zip codes with the poorest health status is 14.4 percent, versus a statewide median of 5.9 percent – or 2.4 times greater.
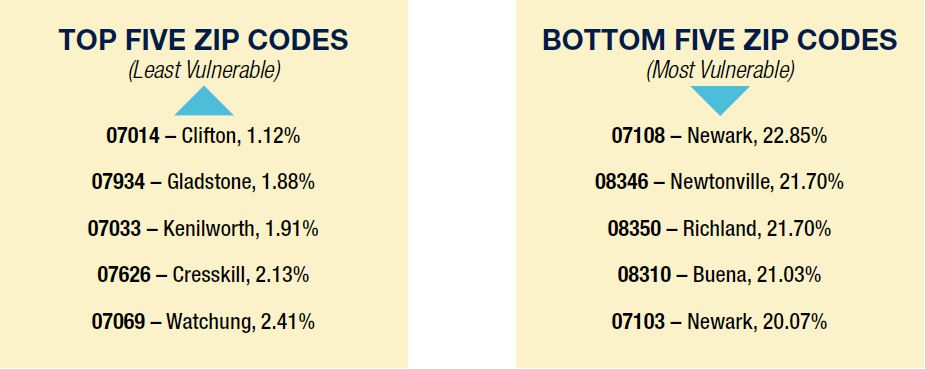
A Deeper Dive
The farmlands of western Atlantic County are home to three of the top five zip codes with New Jersey’s highest unemployment rates: 08346 (Newtonville), 08350 (Richland) – both part of Buena Vista Township – and 08310 (Buena). Tucked between highways 40 and 322, these zip codes are roughly 45 miles from Atlantic City and 50 miles or more to Philadelphia. The bus route from Buena Vista to Philadelphia travels through Atlantic City – making it a three-hour, 45-minute trip. With public transportation extremely limited, residents of Buena Vista Township spend more time in cars riding to work than the national average.28,29
Demographic characteristics and age/race variation
In addition to profiling New Jersey’s 537 zip codes based on the 20 measures selected for this study, CHART also conducted a broad demographic review of communities across the state. New Jersey, like many northeastern states, is a melting pot of young/old, affluent/poor, and a full complement of races and ethnicities.
The median age of New Jersey’s population 41.9 year, and the racial composition is 68 percent White, 13.4 percent Black, 9.4 percent Asian and 9.1 percent other (American Indian, Islander, multi-racial, other). In addition, nearly 20 percent of residents identify themselves as Hispanic. However, comparing the profiles of the strongest 35 zip codes and the weakest 38 zip codes from a health status/vulnerability perspective reveals significant differences in demographics.
The data show that New Jersey’s most vulnerable communities tend to have a population that is younger and predominantly minority than the population of the state as a whole.
ED Chronic Conditions
ED Mental Health/SUD
Low Acuity ED Visits
Life Expectancy
Uninsured
Medicaid
No HS Diploma
Income
Unemployed
Demographics